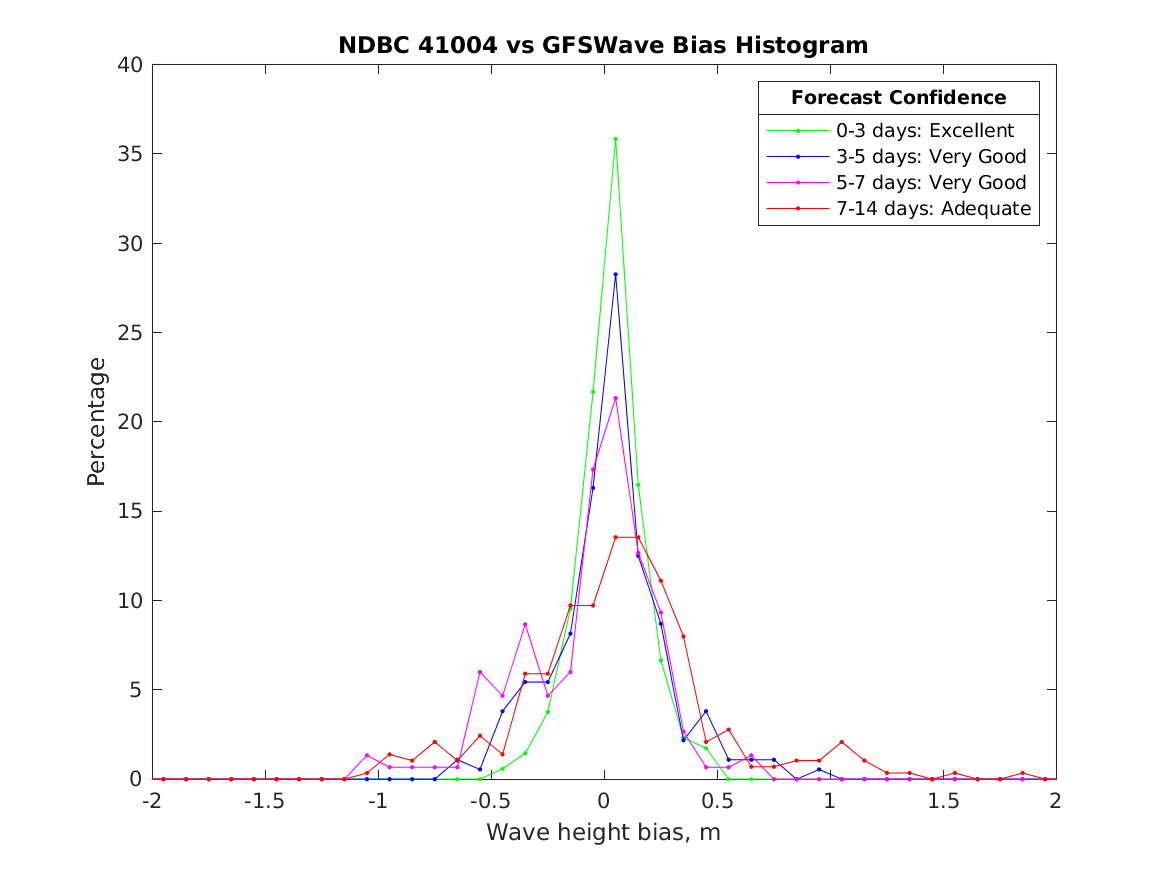
Wave-Buoy Validation – Histogram
Here we examine the forecast confidence of the WAVEWATCH III wave height forecasts compared to the measured significant wave heights from the NDBC buoy. The bias is defined as wave model minus wave measurement. The GFS wave model typically underestimates the actual wave heights, and this bias only gets worse the farther out the forecast is. In the 0 to 3 day period more than 90% of the forecasts are within one foot (0.35m) of the actual wave height. This is considered Excellent. In the 3 to 5 day period 80% of the forecasts are within one foot (0.35m) of the actual wave height. This is considered Very Good. In the 5 to 7 day period only 60% of the forecasts are within one foot (0.35m) of the actual wave height. Anything less than 60% is considered no better than Noise. This validation can be part of your offshore project.
