| |
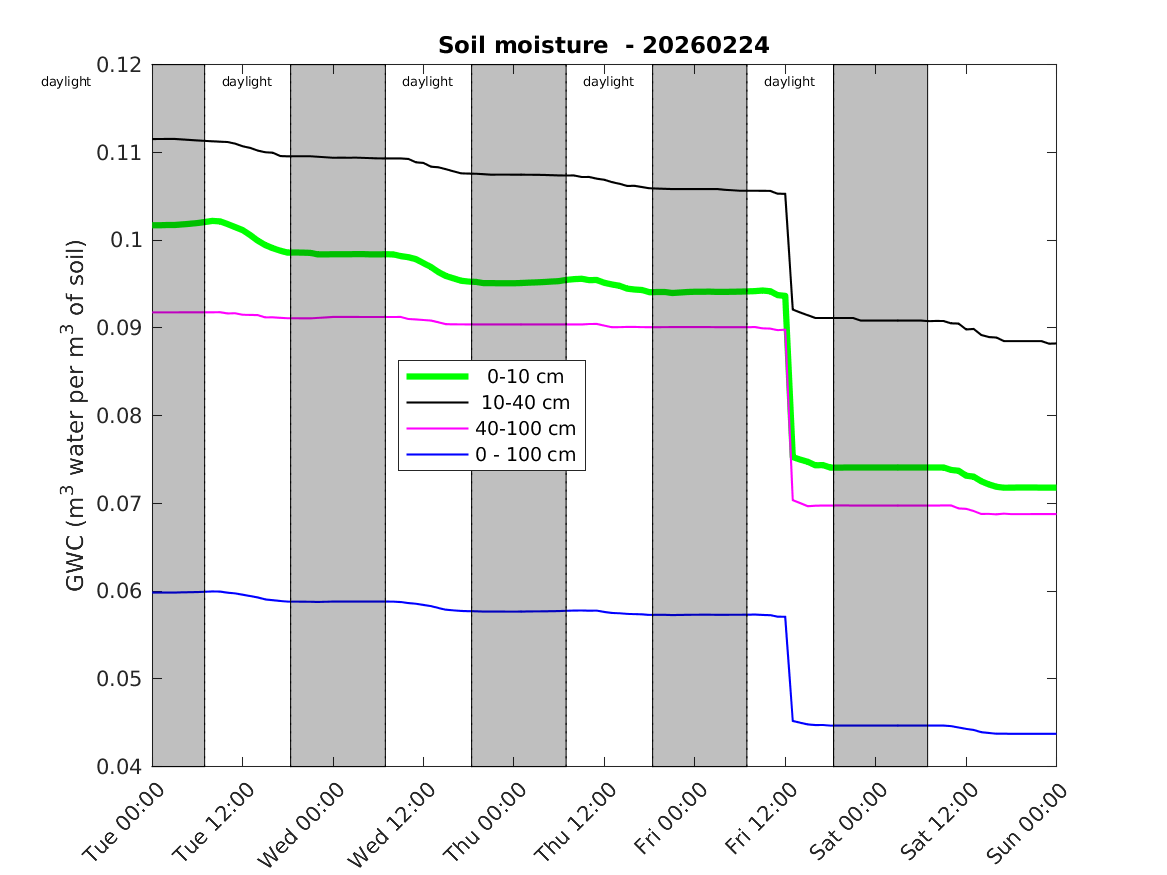 |
About this plot:
Knowing the soil moisture gives the bee keeper a good sense of the growing conditions for flowering plants. Adequate soil moisture from consistent, moderate rainfall throughout the growing season results in greater nectar volume and quality. Too little soil moisture and the plants are stressed. Drought-stressed plants don't produce as much nectar and the nectar invariably has a stronger flavor. Too much soil moisture equates to a lot of rain, which can wash away nectar.
GWC is the Gravimetric Water Content, the amount of water in a cubic meter of soil.
The soil moisture shown in this plot is a mean of the Global Forecast Model (GFS) and US North American atmospheric forecast model (NAM).
See a map (SMAP) of the daily soil moisture level at the surface (compare to the 0-10cm level, green line plotted above) across Texas. These levels are measured by satellite and only see the surface. Zoom in on the map to highlight the specific data for Brazos County.
See a map (Drought) of the present drought conditions for Brazos County.
A plot of the surface (0-10cm) moisture forecast models we examined for this BeeWeather forecast is shown below.
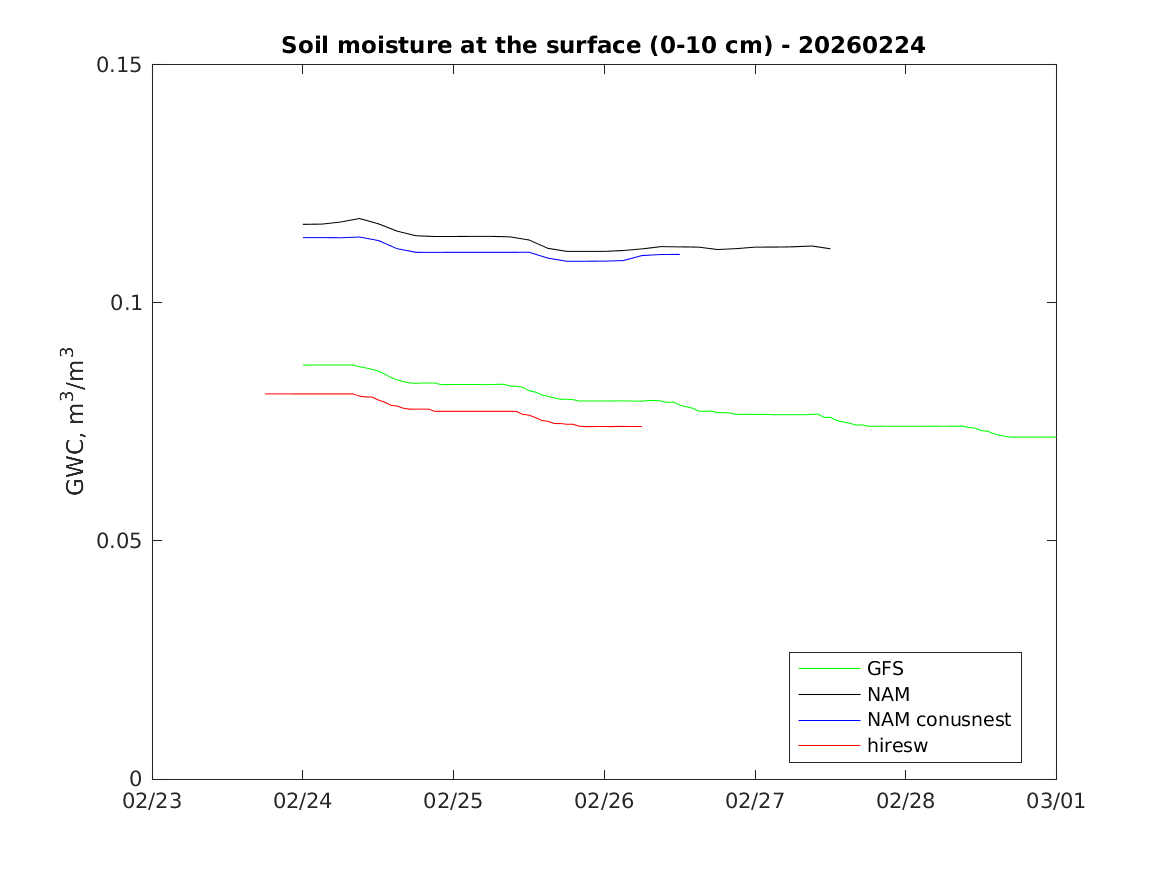
The GFS model (NCEP's Global Forecast Model) is a lower resolution model that covers the entire globe and forecasts out to 14 days. Because of this, it is usually less acurate than the other models. The NAM model (NCEP's North American model) is a higher resolution model that focuses on North America. Consequently it is (can be?) more accurate. The NAM conusnest model (NCEP's model of the continental US, nested inside NAM) is more focused than NAM and generally yields better results. The hiresw model (NCEP's High Resolution Rapid Refresh model covering just the continental US) is highly variable; it can either be very right, or very wrong. For that reason we don't often use it. Finally, we use bilinear interpolation to interpolate the data from the model's four grid points immediately surrounding the site of interest to get the data at the site.
|